Stop Scoring. Start Ranking.


Stop Scoring. Start Ranking.
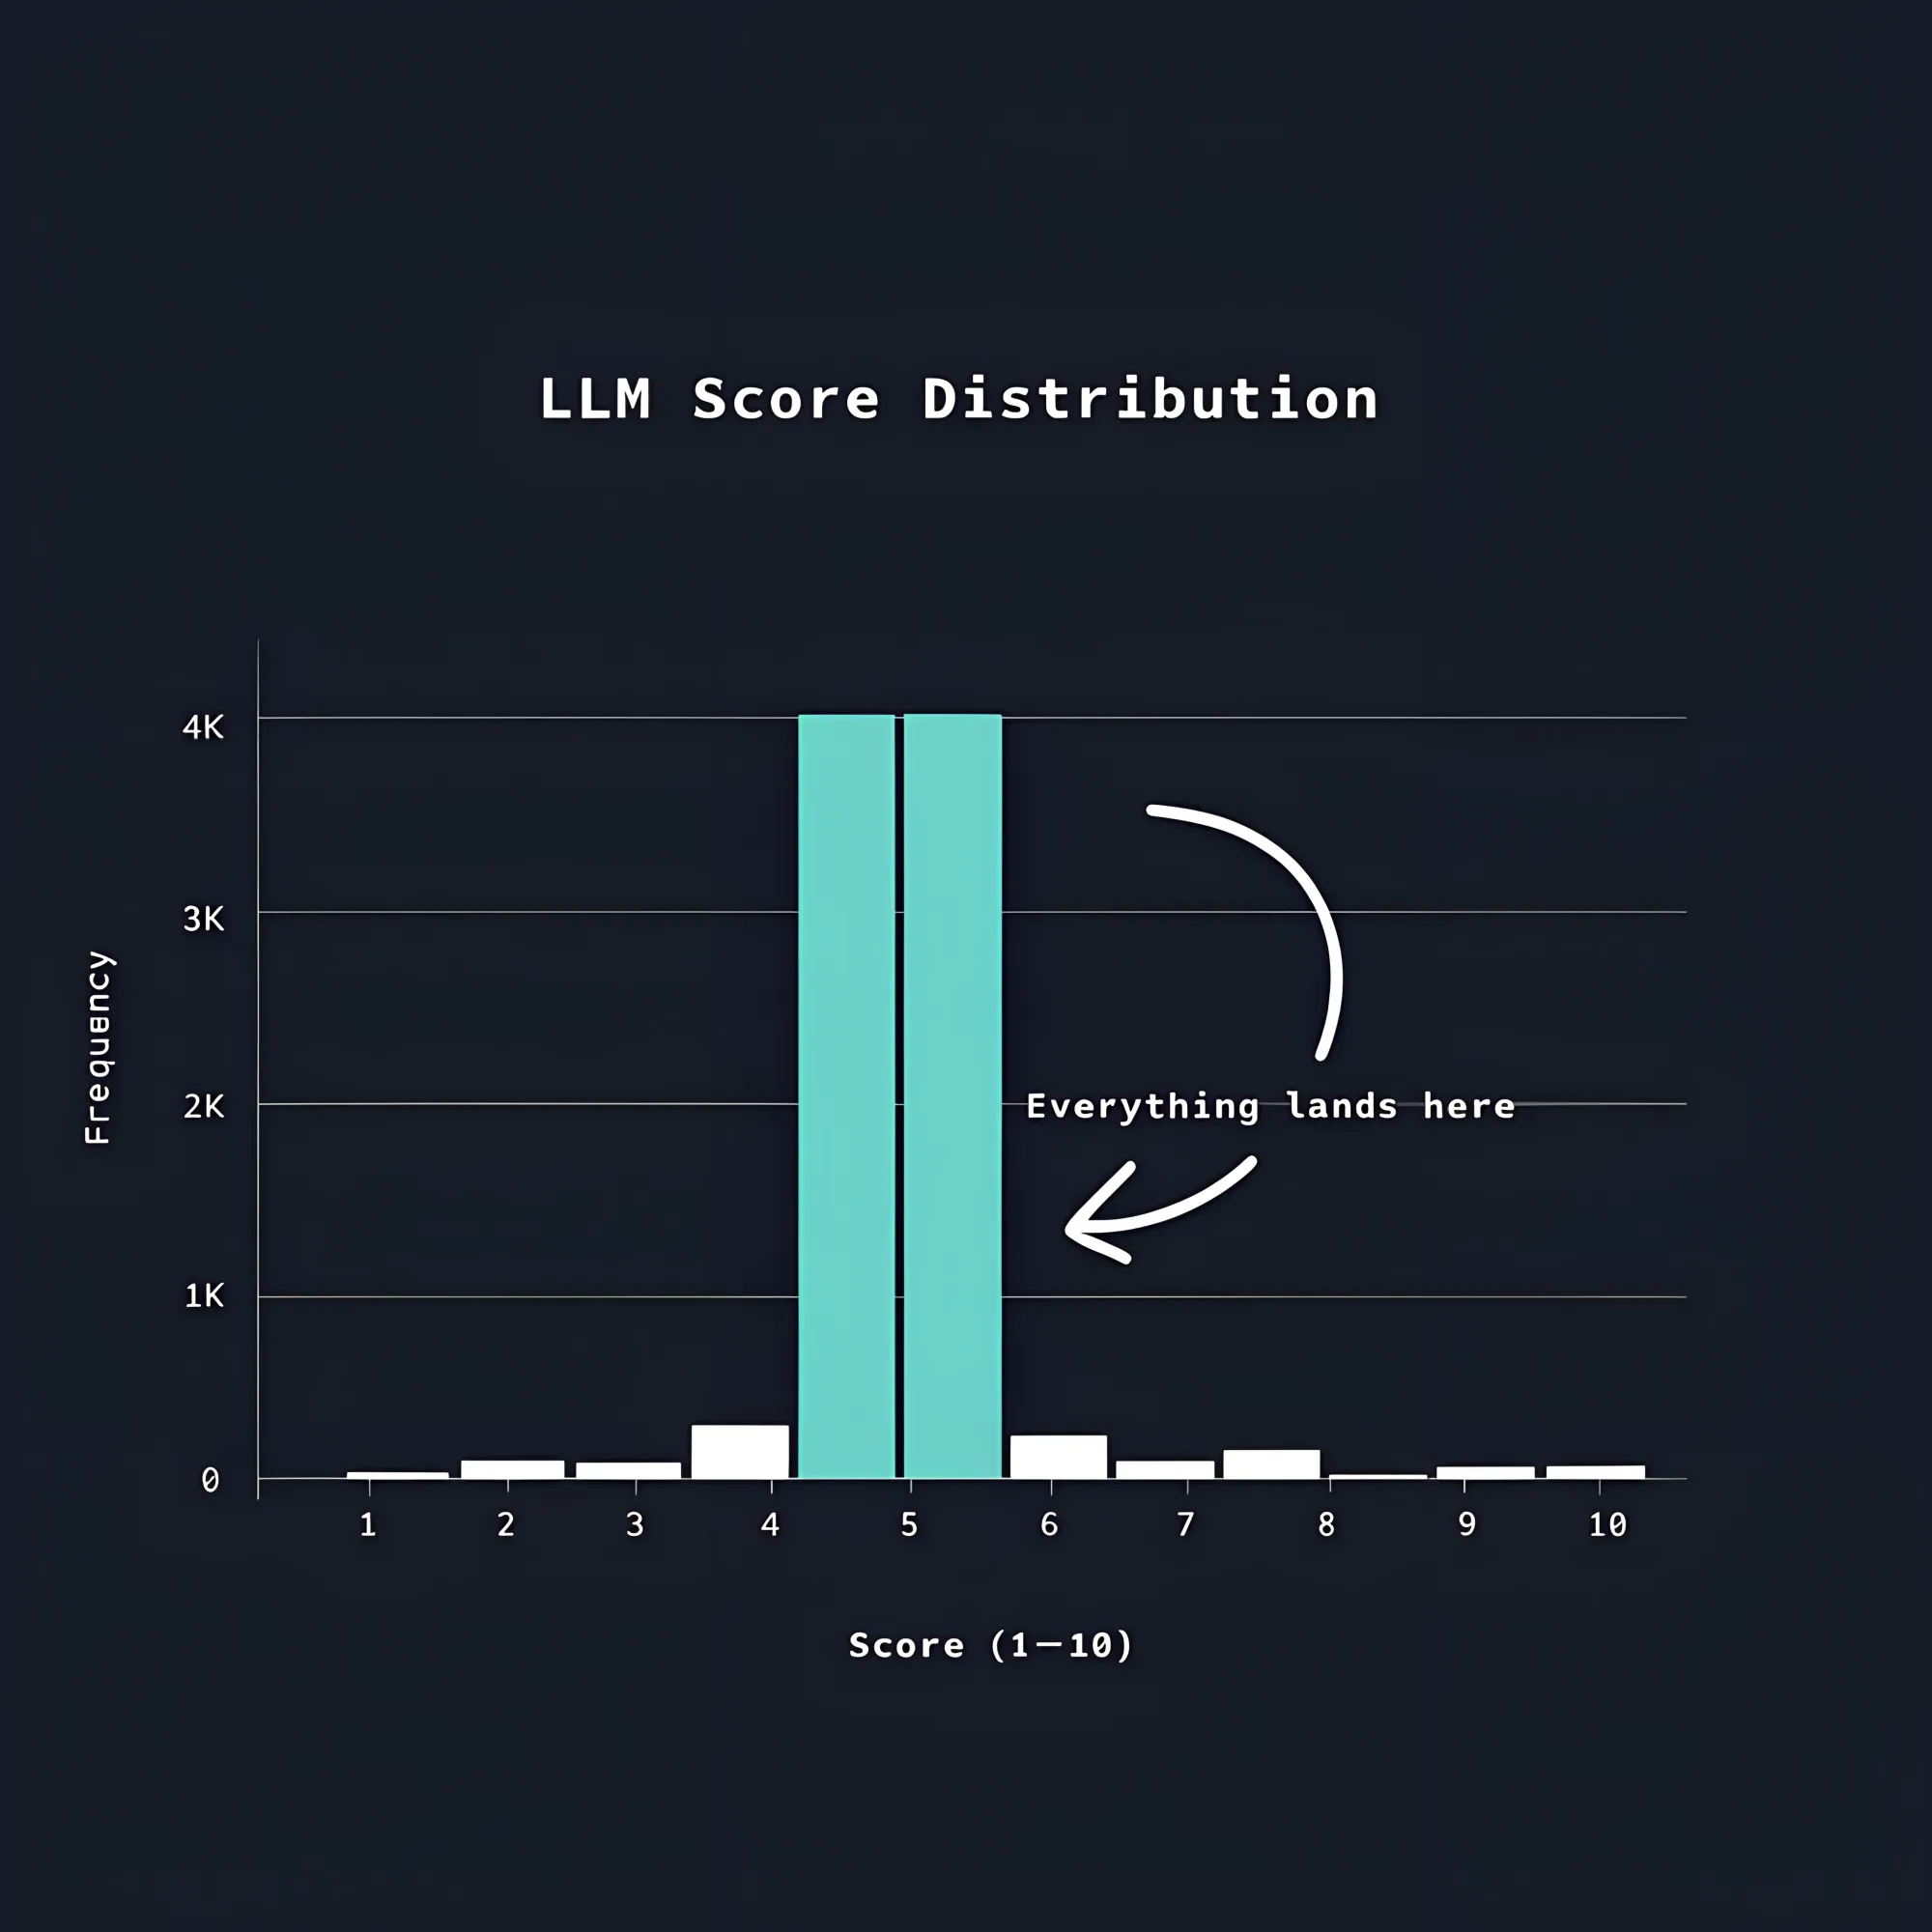
If you’ve asked an LLM to rate a document on a scale of 1 to 10, you might have noticed something strange.
The scores cluster together, most responses land between 3 and 7, and the sorted list you end up with is nearly useless.
LLMs are probabilistic systems, and when asked to produce a numeric rating, they pull from a distribution that don’t resemble anything uniform or normal.
To prove this to yourself, run the same batch of documents through a scoring pipeline and count how often each score appears.
You’ll see clear overrepresentation of whatever the model considers average.
Humans do the same thing when asked to rate without calibration.
The result is that any ranked list built on LLM-generated scores looks precise but isn’t really.
Research on LLM-based evaluation has put numbers to this problem.
A study on Natural Language Generation (NLG) evaluation finds that on certain tasks, a single value dominates the entire score distribution.
That is, the model will score most outputs the same regardless of actual quality differences. [^1]
If you try to smooth this out by running each document five times and averaging the results, you often won’t be fixing the underlying issue.
There is also a directional bias to be aware of: LLM evaluators will systematically rate LLM-generated outputs higher than human-written ones.
This has been shown to be the case even in datasets where human judges prefer the human version. [^1]
On top of that, the human benchmarks you might use to validate your evaluator are themselves unreliable.
Inter-annotator agreement on LLM summary quality has been measured at a Krippendorff alpha of 0.07, which is effectively zero. [^1]
So, what’s the alternative?
There is actually a more reliable way to rank things that doesn’t involve scores at all.
Consider not asking for scores and instead asking a simpler question: between A and B, which one is better?
LLMs can answer that question reliably, even when they can’t produce a calibrated numeric score.
You give the model a pair of items alongside a criterion that defines what "better" means in your context, and as much supporting metadata as you have for each item.
Then you set it up to return which one of the items is the winner in that pairwise contest.
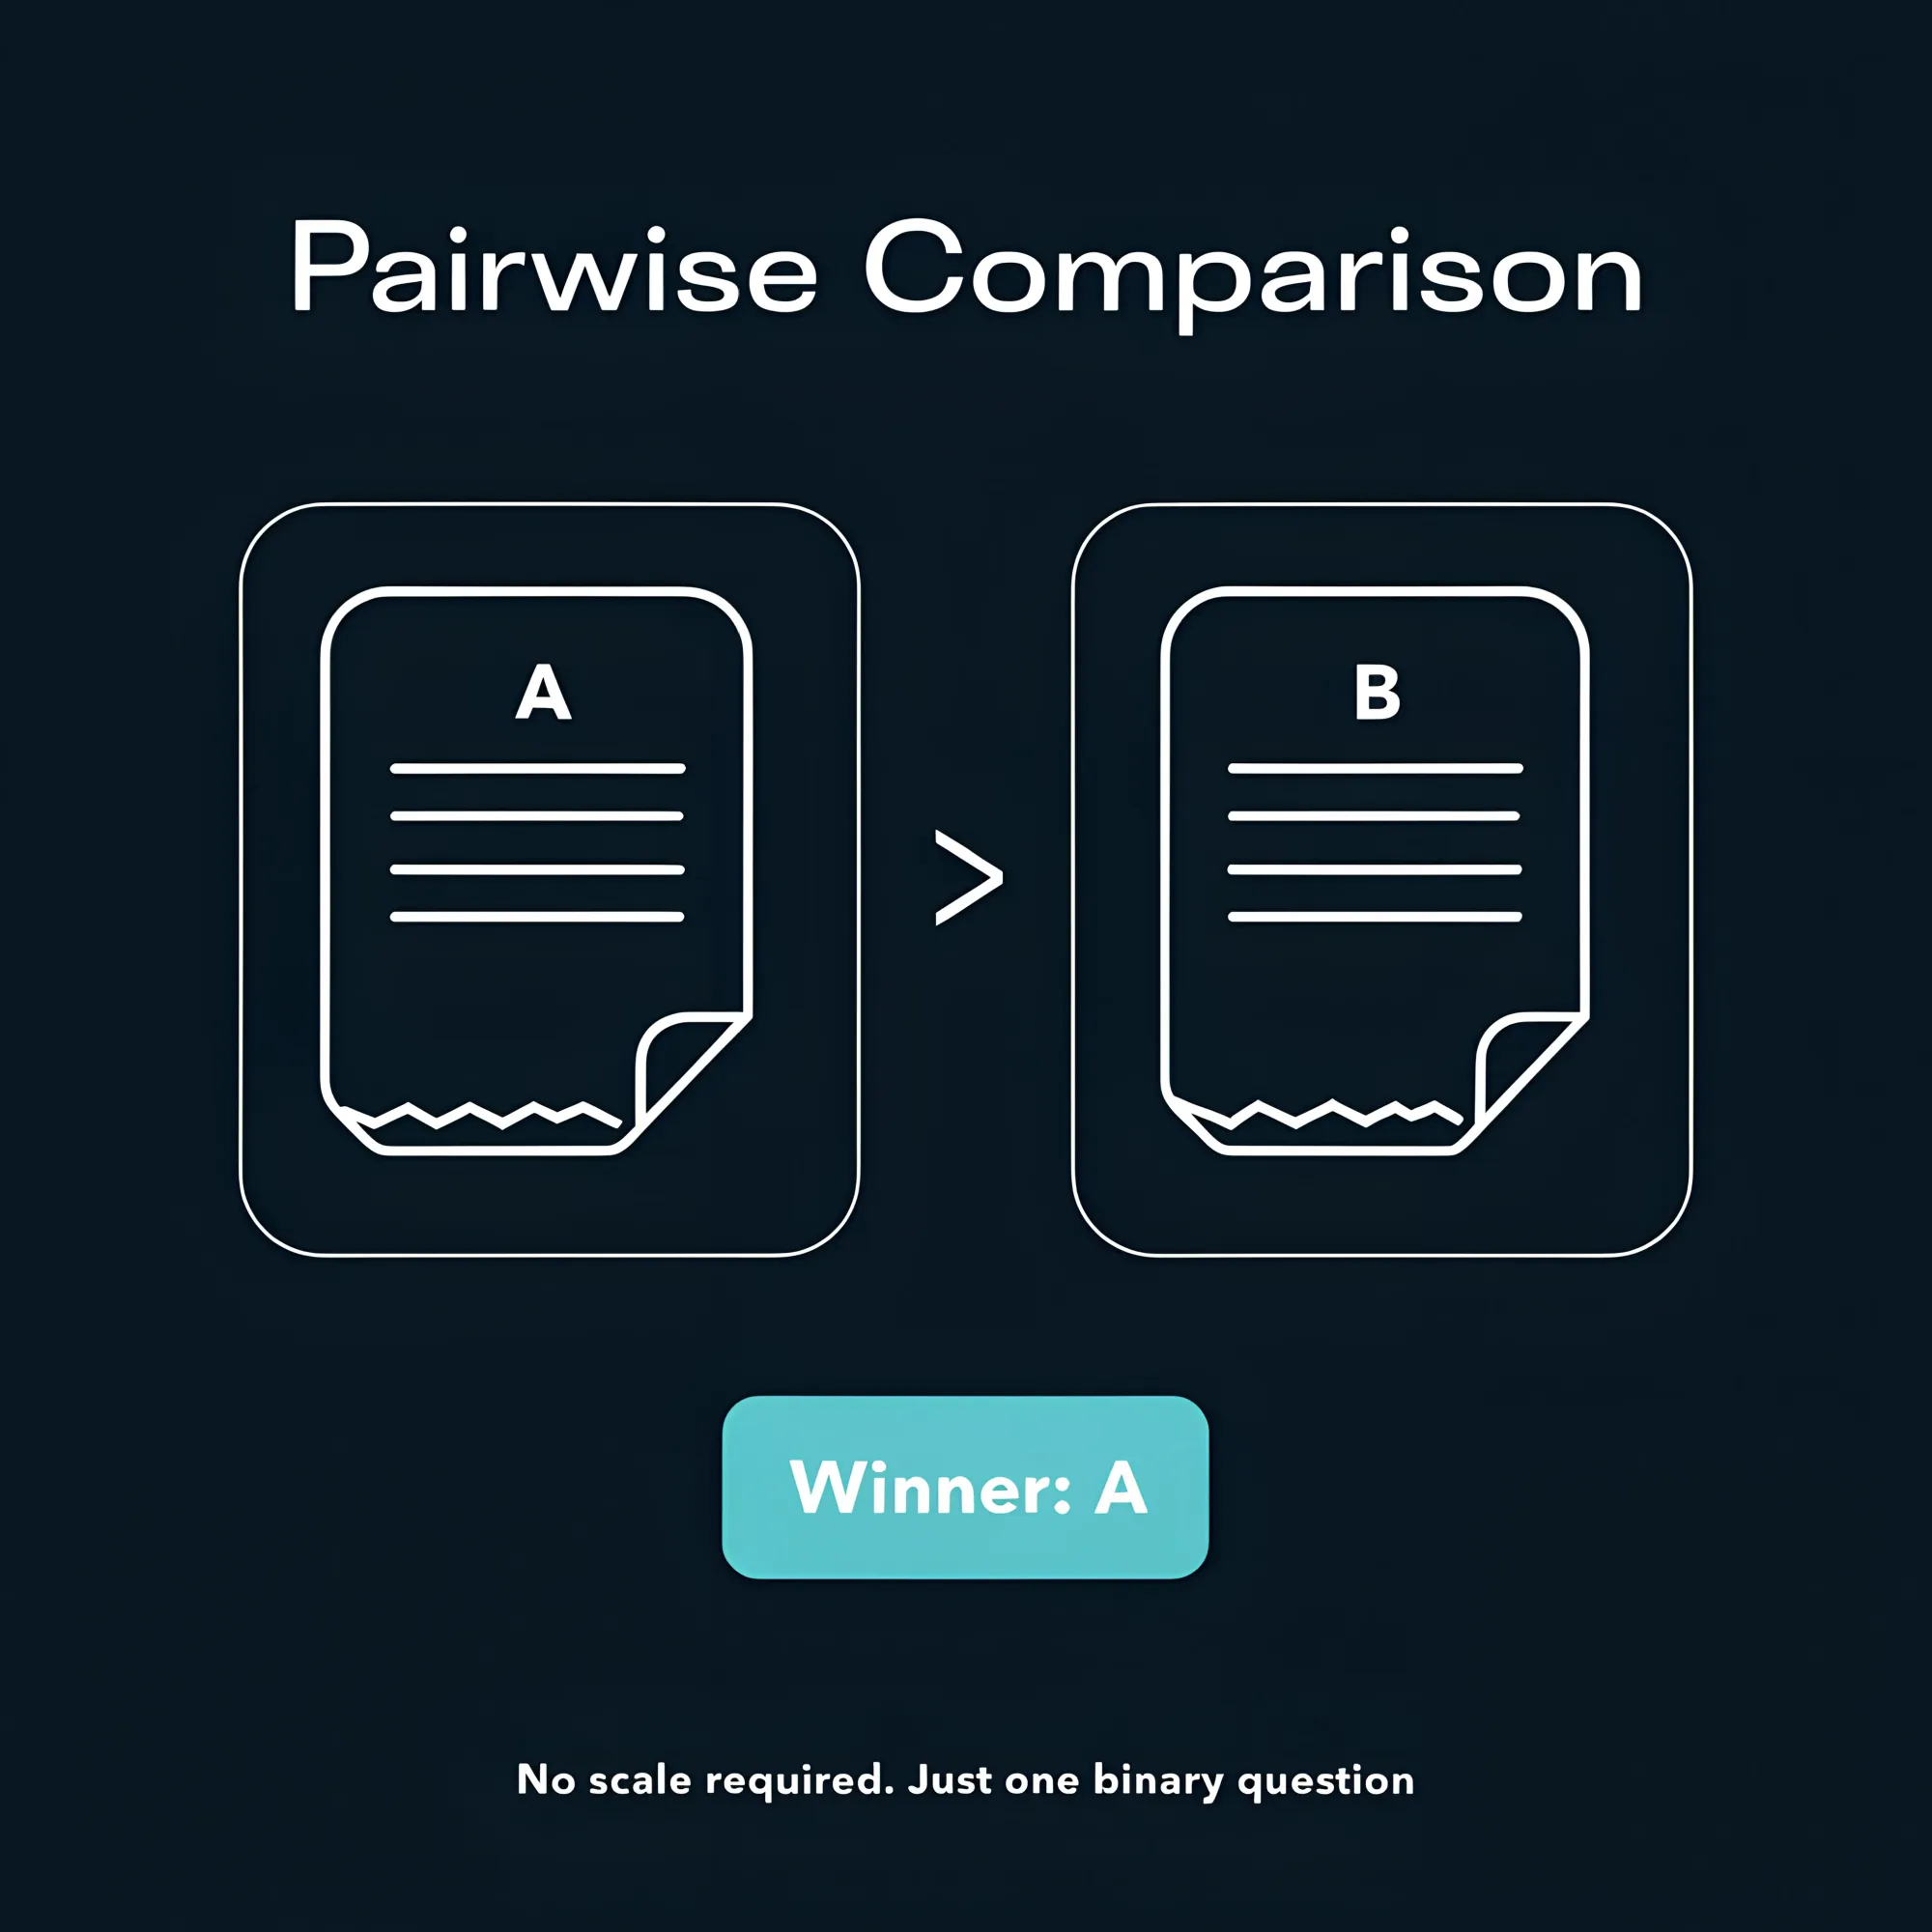
That single binary output is far more stable than a numeric rating.
This is because you’re not asking the model to maintain a consistent internal scale across a full dataset; you’re only asking it to compare two things at a time.
Run enough comparisons across different pairs, and the relative quality of each item in your dataset becomes clear.
This is a way to build a ranking without ever assigning a number.
The process works like this:
- Take all your items and shuffle them randomly, then construct them into pairs for head-to-head comparisons.
- For each pair, pass both items and your criterion to the evaluator and record the winner.
- Run this for 10 iterations (or more) over your dataset, so each item ends up in roughly N different matchups.
- After all the matchups, every item has a win rate: the proportion of matchups it won.
Ten iterations is a reasonable default, but if your dataset is large or your token budget is tight, a sparse analysis, where items only compete against a subset of others, keeps costs manageable while still producing useful signal.
Here is where a small piece of math pays off.
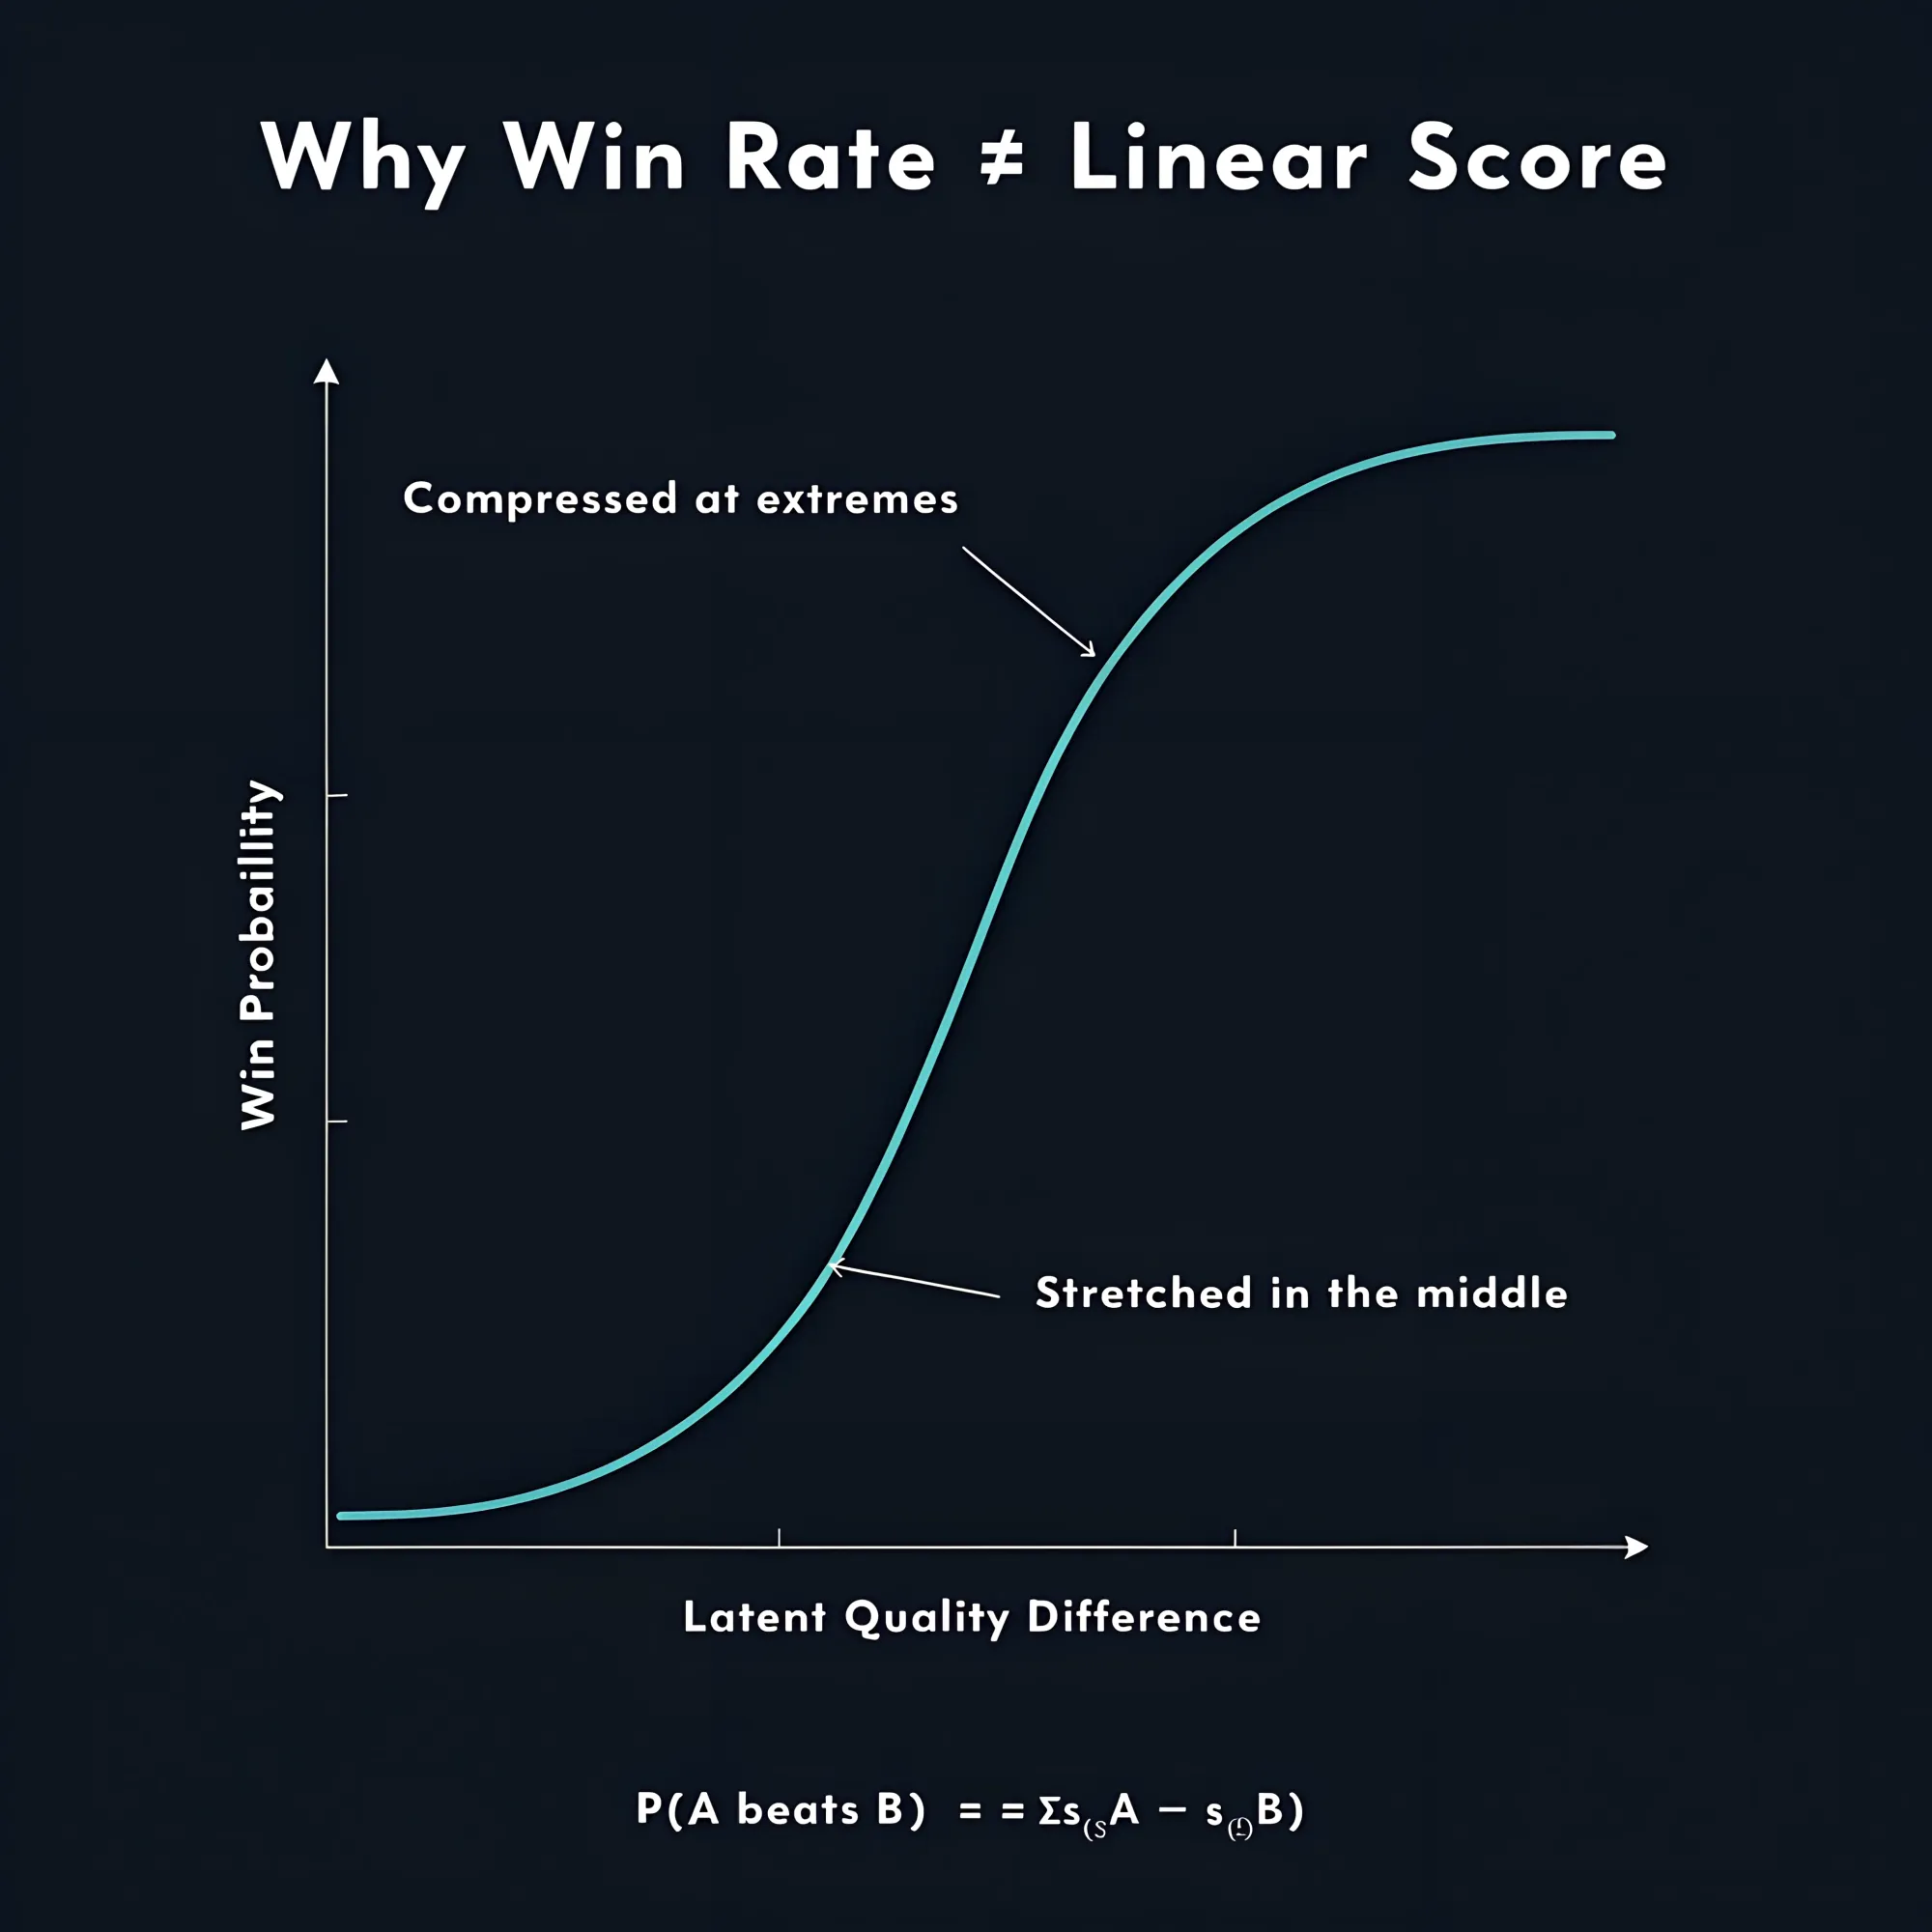
The Bradley-Terry model describes pairwise competition with the relationship:
Where σ is the sigmoid function and s_A and s_B are latent quality scores you can’t observe directly. [^2]
Your observed win rates are the outcome, and you can use the inverse of the sigmoid, the logit function, to work backwards and infer those latent scores.
Although, win rates don’t map linearly to a latent score.
The sigmoid compresses the extremes and stretches the middle, which is useful because most real items cluster somewhere in the middle of any quality distribution.
Once you have those latent scores, you can rank your entire dataset by relative quality, not by individual point estimates that mostly look identical.
A few constraints are worth knowing before you use this.
The self-preference bias already mentioned means that if your dataset mixes LLM-generated and human-written content, the evaluator will lean toward the LLM outputs regardless of what a human would actually choose.
That doesn’t invalidate the method, but it does mean the ranking reflects a specific evaluator's preferences, not some universal measure of quality.
If you are using multiple LLMs as evaluators, consider averaging their votes across all matchups.
This is the simplest way to handle differences in reliability and bias across different evaluators.
More sophisticated approaches can model each evaluator's accuracy explicitly, but averaging is a practical baseline that works well enough for most cases.[^3]
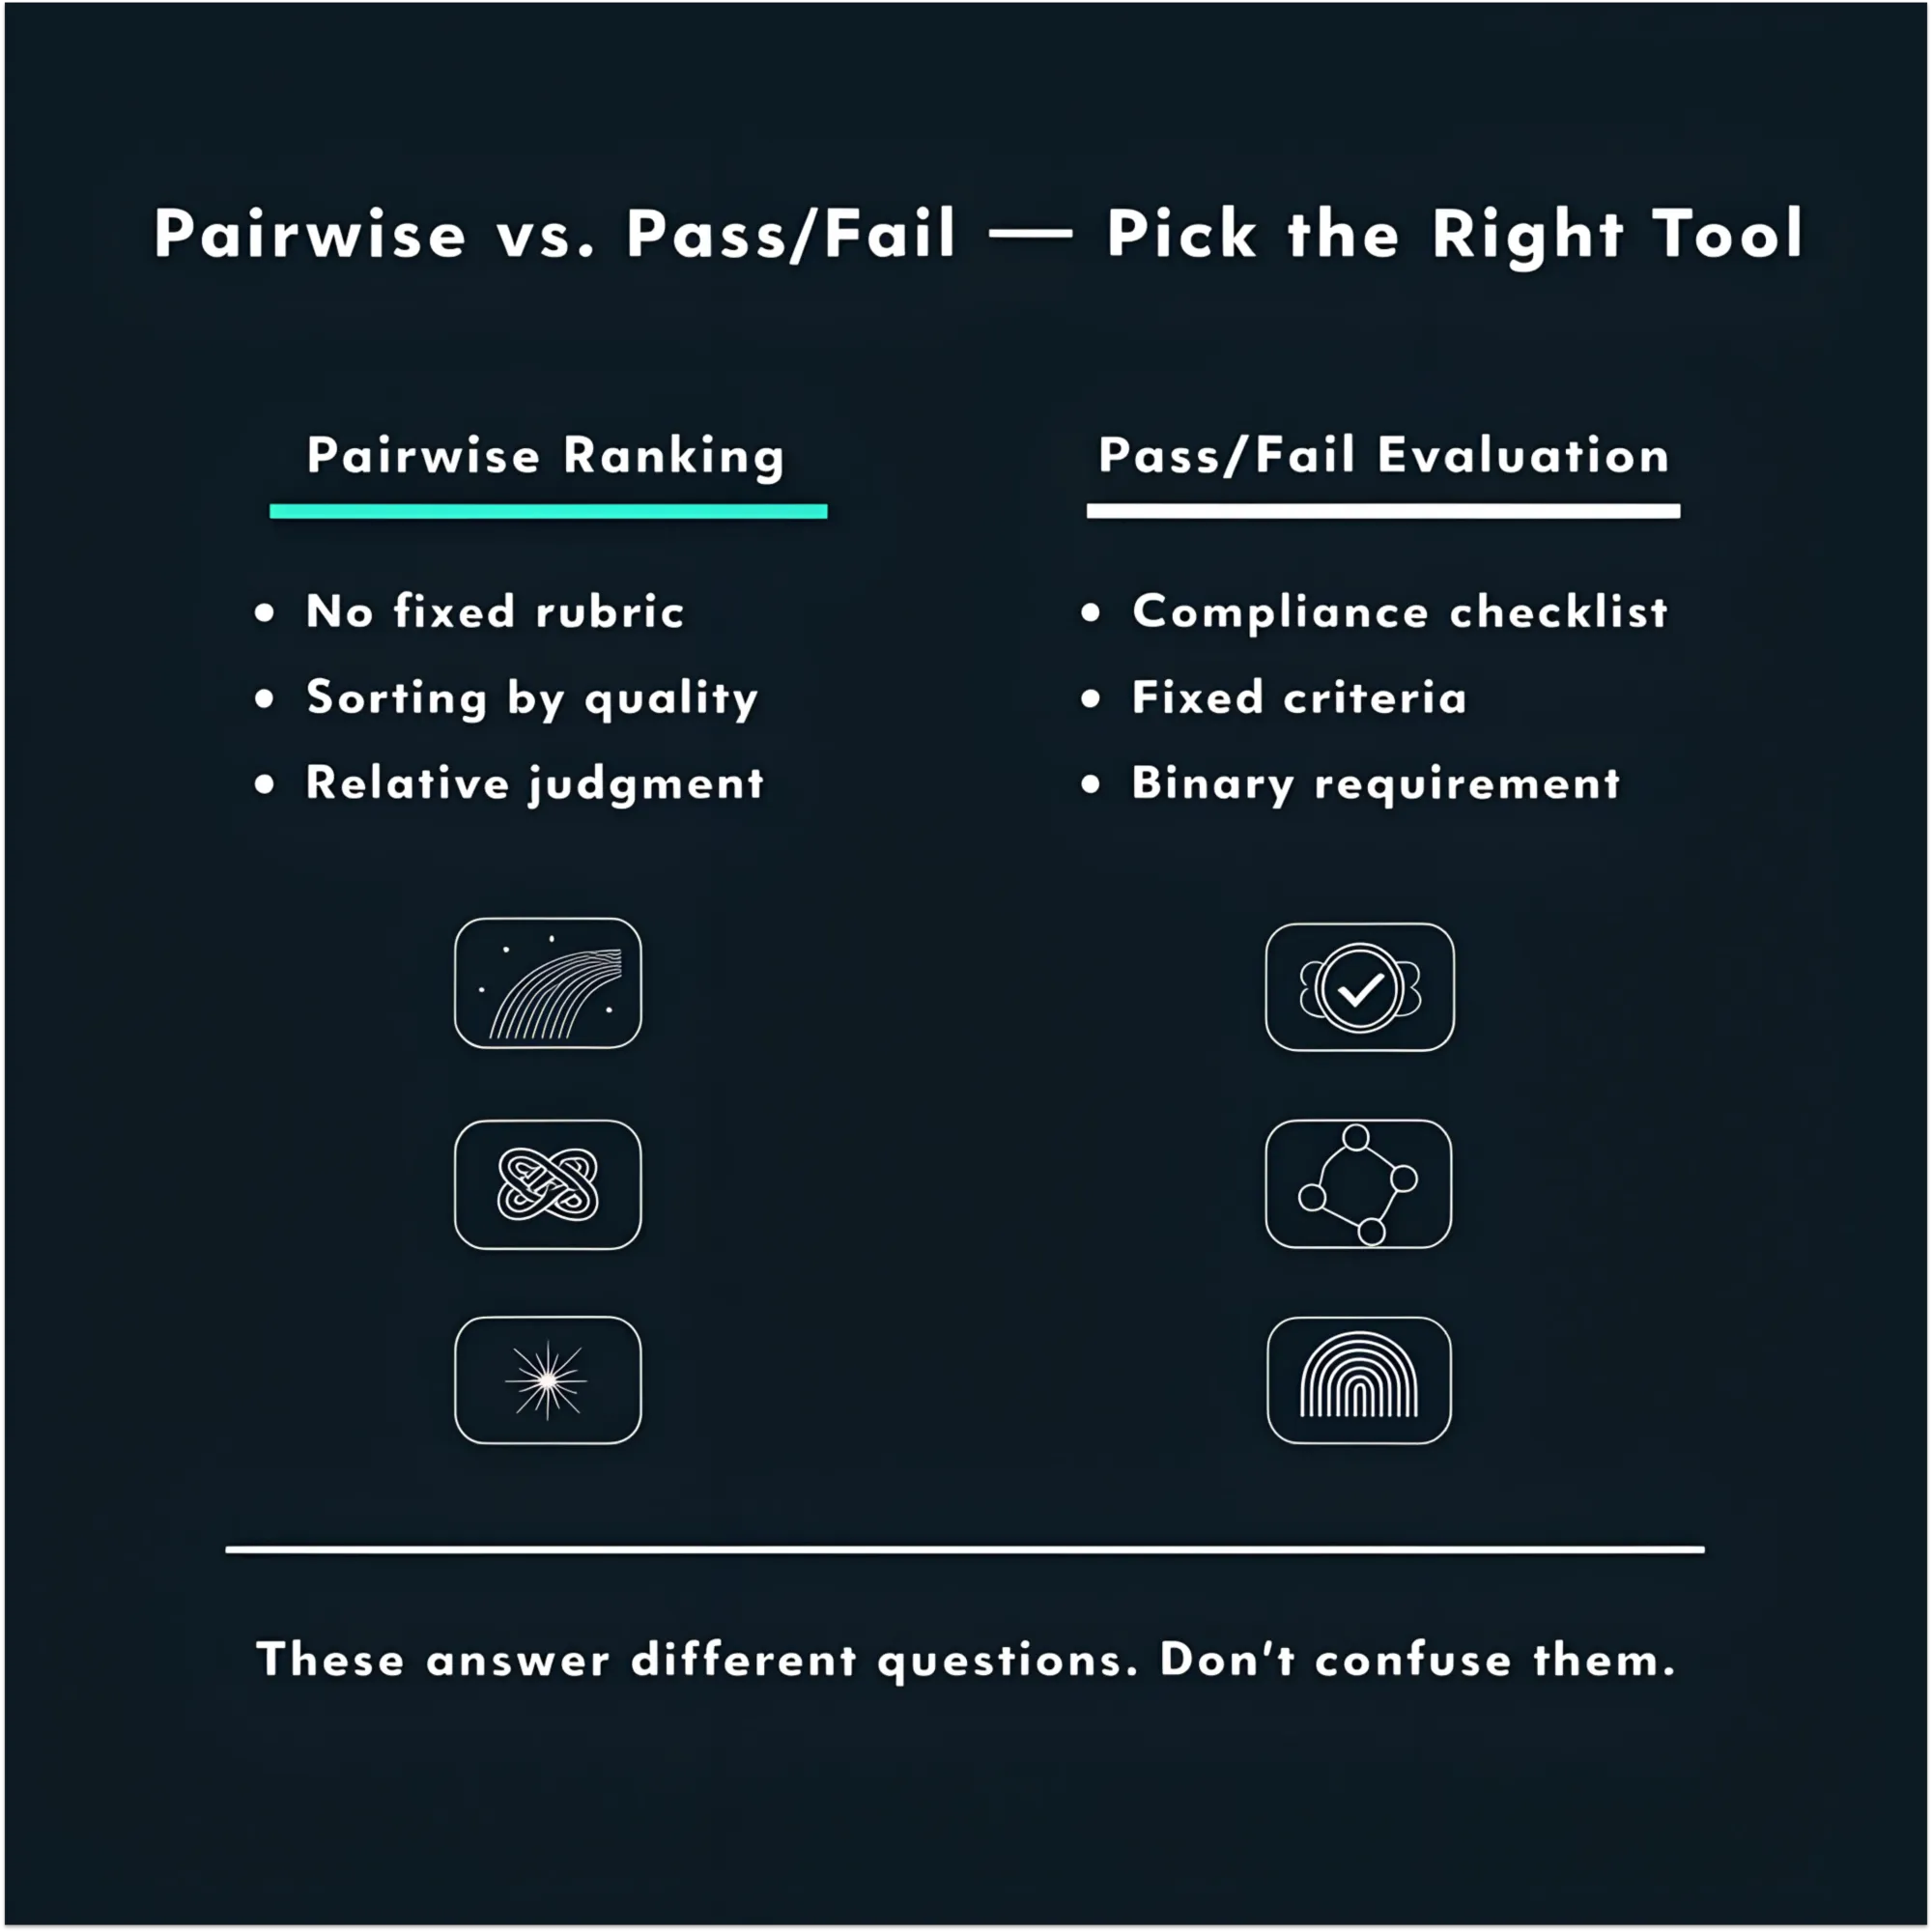
This approach is most useful when you have a list to sort, no clear scoring rubric, and too many items to evaluate manually.
When building a risk matrix from raw documents, you can generate far more candidate risks than you need and use pairwise comparisons to rank them by severity, impact, and how well they are substantiated by the source material.
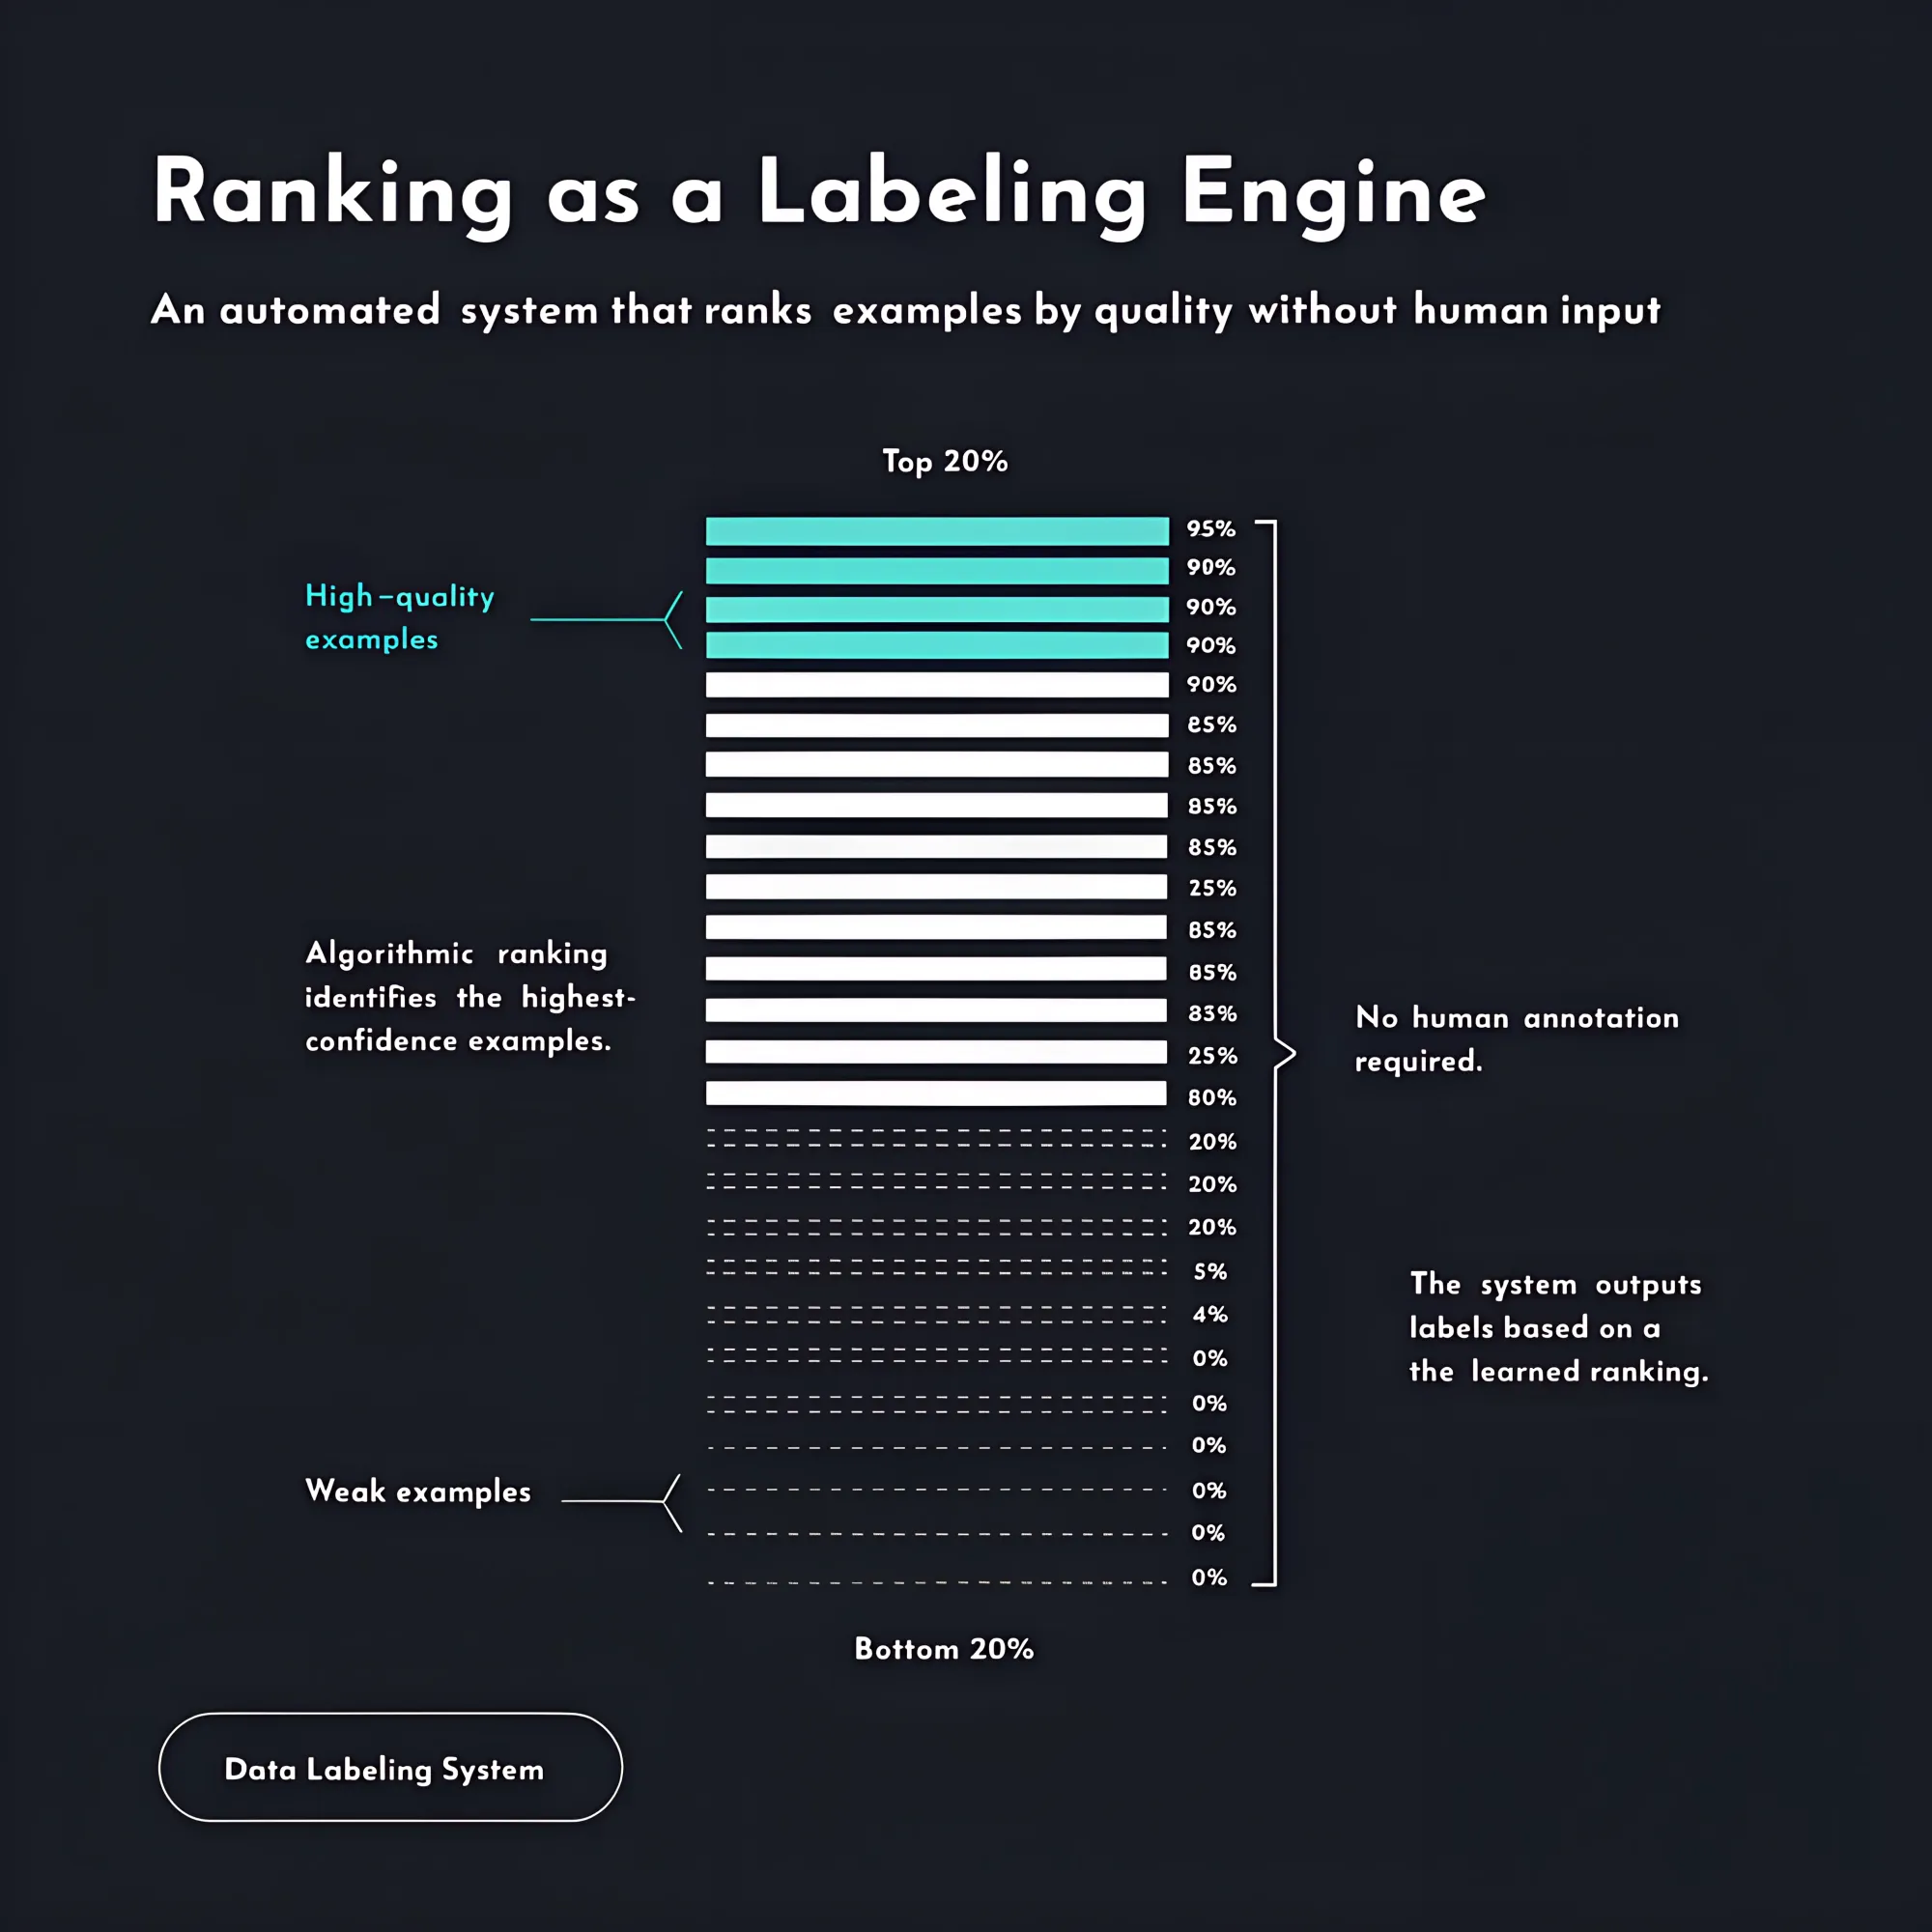
Pull the top 20% and you have a high-quality example set; pull the bottom 20% and you have a weak example set: a labeled dataset for evaluation or fine-tuning, produced without human annotation.
The same logic applies when you need to prioritize leads, emails, or companies where no objective score exists upfront.
Pairwise comparison with latent score inference produces a ranking that matches what a human would arrive at by sorting the list manually.
That is because comparison is how humans actually evaluate things when the task demands real judgment, and mimicking that process turns out to be more reliable than asking for precision that does not exist.
As a final note; I wouldn’t recommend pairwise ranking when you have a checklist to validate against.
If your requirement is that a document must meet specific compliance criteria or pass a fixed set of rules, you’re asking a binary question, not a comparative one.
Use pairwise for ranking by quality; use pass/fail evaluation for fixed requirements.
[^1]: Liu, Y., Iter, D., Xu, Y., Wang, S., Xu, R., & Zhu, C. (2023). G-EVAL: NLG Evaluation using GPT-4 with Better Human Alignment. EMNLP 2023. The Krippendorff alpha of 0.07 figure is originally from Zhang, T., Ladhak, F., Durmus, E., Liang, P., McKeown, K., & Hashimoto, T. B. (2023). Benchmarking Large Language Models for News Summarization, as cited in G-EVAL.
[^2]: Bradley, R. A., & Terry, M. E. (1952). Rank analysis of incomplete block designs: I. The method of paired comparisons. Biometrika, 39(3/4), 324–345.
[^3]: Qian, M., Sun, G., Gales, M. J. F., & Knill, K. M. (2026). Who can we trust? LLM-as-a-jury for Comparative Assessment. University of Cambridge.