Your LLM-As-A-Judge Might Be Lying to You


You build a pairwise eval pipeline, run it over your dataset, and get a clear winner.
You ship the change.
A few days later you pull the logs to double-check, and something doesn't add up: A beat B, B beat C, and somehow C also beat A.
That loop shouldn't exist.
In fact, if your evaluator were consistent, it cannot possibly produce it.
The answer is clear. Your judge is lying to you.
I established in a previous post the fact that pairwise comparison beats numeric scoring because models collapse numeric distributions.
In comparison, "which is better, A or B?" is a far simpler question for a model to answer reliably.[^1]

But pairwise eval introduces its own failure modes that are easy to miss.
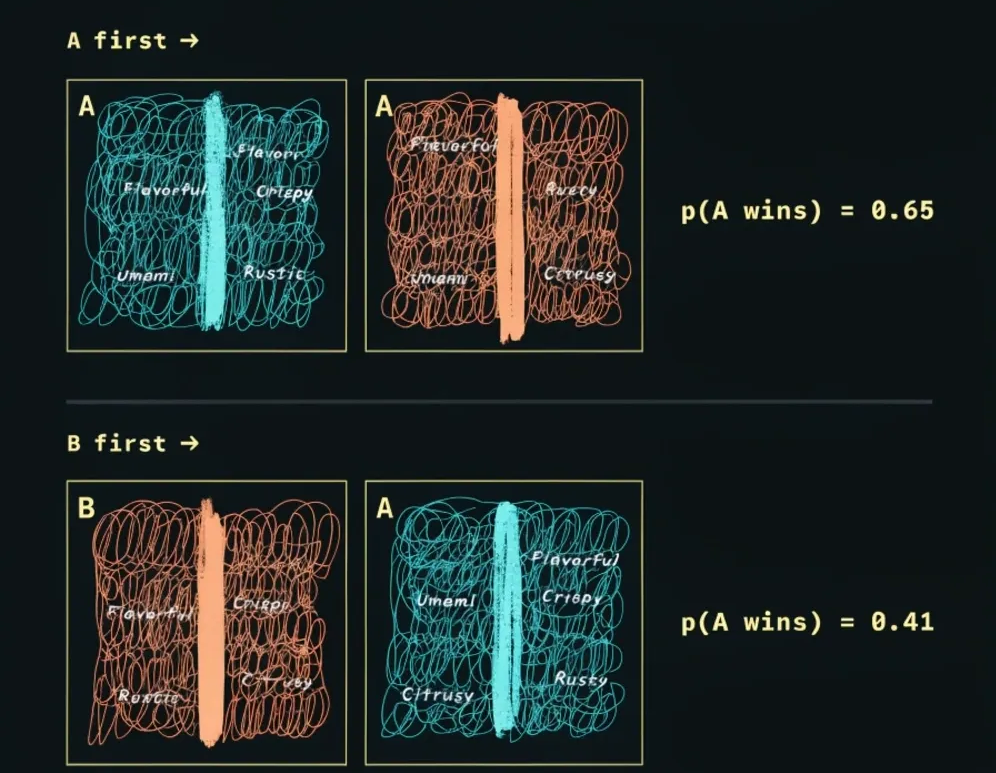
The first is positional bias: compare A vs B, and the model gives you a probability that A wins.
Then, flip the order and compare B vs A.
If you take the two probabilities and add them together, they should sum to one.
In practice, they don't.
LLMs systematically favour whichever item appears first in the prompt, so the probabilities from the two orderings are asymmetric and inconsistent.
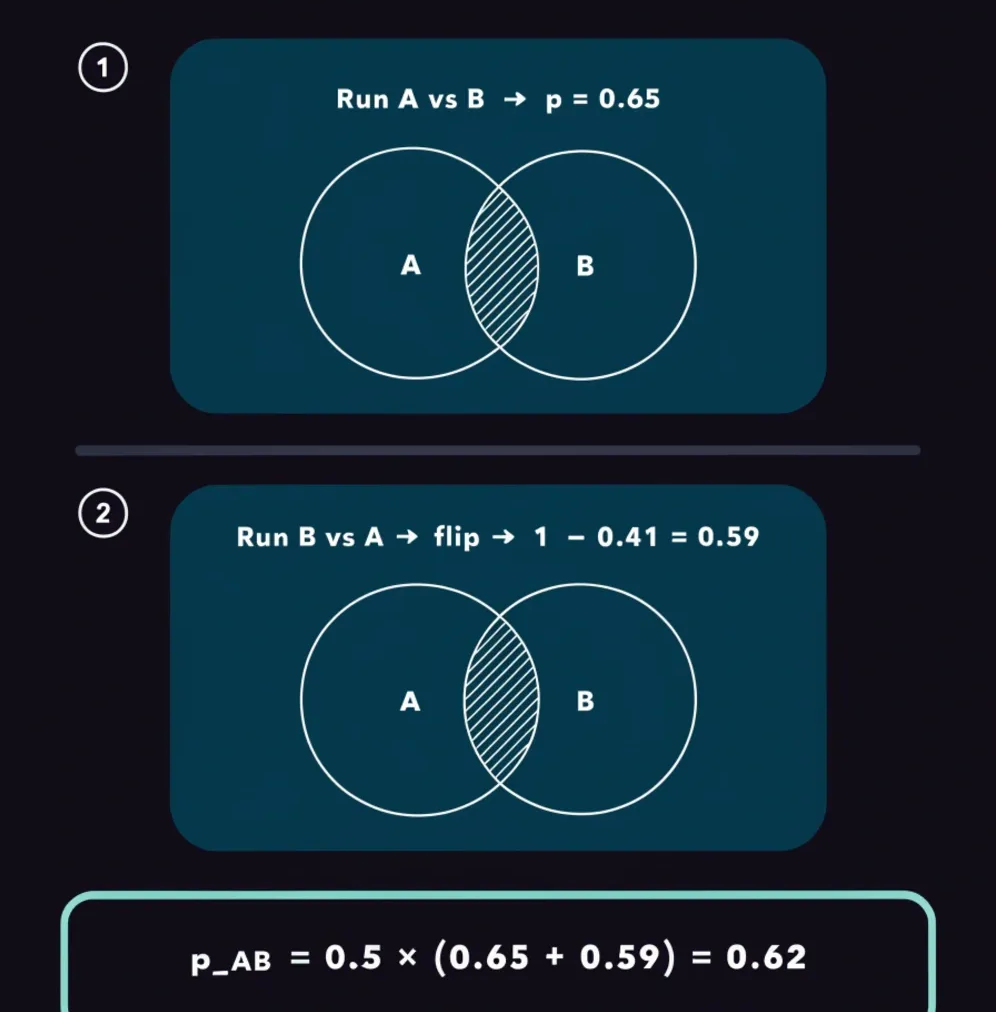
The fix is to run all pairwise comparisons forward and backwards, then average: p_AB = 0.5 × (p(A|AB) + (1 - p(B|BA))).[^2]
In plain terms: ask "how likely is A to win when A goes first?" then ask "how likely is B to win when B goes first?" and flip that second answer around (since if B wins 70% of the time, A wins the other 30%).
Average those two numbers and you get a single, balanced estimate that irons out whichever direction the model was leaning.
The second failure mode is cycle inconsistency, which is exactly what is behind the A, B, C loop in the opening paragraph.
A reliable evaluator must satisfy transitivity: if A beats B and B beats C, then A must also beat C.
When this breaks down, you get a cycle: A beats B, B beats C, C beats A. In this case, you can't tell who is better, A or C.
You can measure this directly with cycle rate: for every triplet of items in your dataset, or a random sample if the set is large, count how many form a directed cycle and divide by the total number of triplets checked.[^2]
That ratio is your cycle rate.
On a well-calibrated model this number should sit below 0.2.
Research on LLM-as-a-jury systems has found that some models hit median cycle rates of 0.7 or 0.8, meaning they produce circular rankings more than two thirds of the time.
Objectively, these models cannot be trusted as pairwise judges regardless of how capable they look on other benchmarks.[^2]
If you have multiple candidate judges, run all of them, compute the cycle rate for each, and then use Spearman Rank Correlation (SRC) to find which ones agree with the rest of the panel.
For each pair of judges, rank every item under each judge, compute the difference in rank position for each item, square those differences, sum them, and plug into: SRC = 1 - (6 × Σd²) / (n × (n² - 1)).[^3]
A high SRC means the two judges agree on ordering.
A judge with a high cycle rate will also produce low Spearman correlation with the rest of the panel, which flags it as unreliable without requiring any human-labelled data.
Run the cycle rate check and the Spearman check together and you have an objective, unsupervised signal for evaluator reliability before you trust any result.
Even after you down-weight the unreliable judges, the ones that remain will each carry their own idiosyncrasies.
One model might favour formal language; another might penalise repetition more harshly than a human would; a third might be systematically easier on shorter responses.
This is an argument for diversity in your judge panel, not just size.
When you aggregate across judges from different model families, individual biases tend to cancel each other out rather than compound.
Keep at least two or three judges from different families, cut the ones that fail the cycle rate check, and average everything else.
Here's a final example comparing two systems of summarising legal documents.
You have two prompt variants generating summaries of the same document and you need to tell a stakeholder which one is better.
The naive approach is to score each summary on clarity, structure, and conciseness, but that will often produce scores that are not representative of its quality over the whole data set.
The better approach is to ask, given the original document, which of these two summaries is a better representation — A or B?
Run every comparison in both orderings, pick two or three judges from different model families, and compute the cycle rate for each judge before you trust the results.
Any judge above a 0.2 cycle rate is a flag worth investigating; anything above 0.5 should be cut from your panel entirely.
What you hand to your stakeholder is this: "version B won 73% of pairwise comparisons across three judges with a mean cycle rate of 0.11."
That number has an objective basis, it is reproducible, and it tells you something about the reliability of the measurement itself.
[^1]: Liu, Y., Iter, D., Xu, Y., Wang, S., Xu, R., & Zhu, C. (2023). G-EVAL: NLG Evaluation using GPT-4 with Better Human Alignment. EMNLP 2023. The Krippendorff alpha of 0.07 figure is originally from Zhang, T., Ladhak, F., Durmus, E., Liang, P., McKeown, K., & Hashimoto, T. B. (2023). Benchmarking Large Language Models for News Summarization, as cited in G-EVAL.
[^2]: Qian, M., Sun, G., Gales, M. J. F., & Knill, K. M. (2026). Who can we trust? LLM-as-a-jury for Comparative Assessment. University of Cambridge.
[^3]: Spearman's Rank-Order Correlation — Statistical Guide. Laerd Statistics. https://statistics.laerd.com/statistical-guides/spearmans-rank-order-correlation-statistical-guide.php